The Engine We Lost: Digital Archaeology of Opera Presto
Opera Dragonfly and Shadow DOM
Contents
- XXVI. The Age Before F12: Alert-Driven Development
- XXVII. Dragonfly: A Thing-in-Itself
- XXVIII. What Can’t Dragonfly Do?
- XXIX. A History of Shadow DOM, and Why It Exists
- XXX. The Illusion of Simplicity
- XXXI. What’s Next?
This week I’m going to tell you about two subsystems that are finally ready. One of them is old, bump-started back to life; I mean the magnificent Opera Dragonfly debugger. The second one is a brand-new implementation of the Shadow DOM API.
These are far from the only improvements and fixes Presto received over the past week. CSS is being refined, new Web APIs are being written, and a truly gigantic track of ECMAScript work has been started. Finally, the language file build system has been rewritten from Perl to Python, and 7zip has been thrown out—archiving is available both in Python and in modern operating systems directly. The tooling has now been simplified as far as it will go.
XXVI. The Age Before F12: Alert-Driven Development
Today, for any web developer, the F12 key (or Ctrl+Shift+I) is an unconditional reflex. Layout gone sideways? F12, click the element, fix the CSS right there in the browser. Script blew up? F12, console, click the stack trace, and you’re in the debugger. Request hanging? The Network tab will break every request and response down into its parts. Modern DevTools are a dashboard that lets you inspect and change the state of any subsystem.
But the web of the early 2000s was written with no instruments at all. We flew through the fog by the seat of our pants.
If you didn’t live through those days, you’ll find it hard to believe how excruciating building and debugging even simple pages was. We had exactly one inspection tool built into the browser—the View Source command.
The problem with View Source was that it showed the static text that had come from the server. If your JavaScript modified the DOM, added nodes, or changed classes—you did not see it. You looked at the original HTML and tried to model in your head what it was supposed to look like after your scripts had had their way with it. We were like prehistoric programmers compiling a program in their heads before punching the cards.
How did we debug layout? By the red border method. If floats came apart and table layout refused to center, the developer would open a text editor, find the suspicious block, and write:
border: 1px solid red;
Save. Alt-Tab to the browser. F5. Look at where the red line ended up. Aha, the block escaped its parent. Alt-Tab back. Add border: 1px solid blue; to the neighboring element. Save. F5. Repeat until enlightenment.
With JavaScript it was even more dramatic. There was no console.log, because there was no console to begin with. If a script had a syntax error, Internet Explorer 6 might show a tiny yellow triangle with an exclamation mark in the bottom-left corner. Clicking it produced an utterly useless message along the lines of: “Error on line 42: Object expected”. What object? Why line 42, when my file only has 20 of them? Figure it out yourself.
The main and only tool for debugging JS was alert().
This was called Alert-Driven Development. To find out whether execution reached the right if branch, you typed in alert('here'). To check the value of a variable—alert(myVar).
And two disasters were waiting for you here. The first: if the variable was an object, the browser handed you a box reading [object Object] and no information whatsoever about its innards. The second: if you accidentally left an alert inside a loop with ten thousand iterations, your only remaining option was to kill the browser process through Task Manager, because the modal window blocked everything dead.
At some point Microsoft released the separate, heavyweight Microsoft Script Debugger, and Mozilla got the DOM Inspector—an overloaded, unintuitive monster that worked more like a utility for debugging the Gecko engine itself than web pages.
Everything changed in January 2006.
The name of the man who changed web development forever is Joe Hewitt. He is the one who created Firebug—a Firefox extension that split the history of front-end development into “before” and “after”.
Firebug wasn’t the first debugger in history, but it was the first to implement the paradigm we take for granted today. It gave us a live DOM tree, where nodes could be expanded with a click and the changes made by scripts showed up in real time. It gave us a style inspector where CSS properties could be switched on and off with checkboxes. It gave us console.log() and a humane console instead of endless alerts. It showed us the waterfall of network requests.
Firebug was so overwhelmingly, mind-blowingly good that web developers moved to Firefox en masse just for it. The fox’s share was growing rapidly, and other browser vendors realized: developer tools are an enormous competitive advantage. Tools have to be built right into the browser (this is how the WebKit Web Inspector would later appear, evolving into today’s Chrome DevTools).
Opera Software, with its principle of “we do everything ourselves and we do it with a vision,” couldn’t stay out of it. They needed their own answer to Firebug. An answer that was powerful, fast, cross-platform, and preferably capable of debugging pages not only on the desktop but on mobile devices, where Opera ruled the roost at the time.
Their answer was called Opera Dragonfly.
From an engineering standpoint it was a masterpiece. Opera’s architects decided not to bake the debugger’s UI into the browser core, but to make it… an ordinary web application. The engine exposed access to its own guts over an internal protocol (scope), while the Dragonfly interface itself was loaded from the network and talked to the engine exactly the way it would talk to a remote server. This elegantly solved two problems at once: the debugger’s interface could be updated independently of the browser’s own releases, and remote debugging of a phone from a desktop worked literally out of the box—you only had to forward a port.
Dragonfly and its development tools are open source under Apache-2.0, so it can be studied, modified, and used without restrictions. Let’s do exactly that.
XXVII. Dragonfly: A Thing-in-Itself
The first thing I managed to check was whether the original version worked as is. Almost no problems: the built client loaded from a local file, brought up a scope connection, and showed the DOM tree, the CSS cascade, the resource tree, localStorage, and cookies. The JS debugger works, although it predictably falls over when parsing unfamiliar JS expressions.
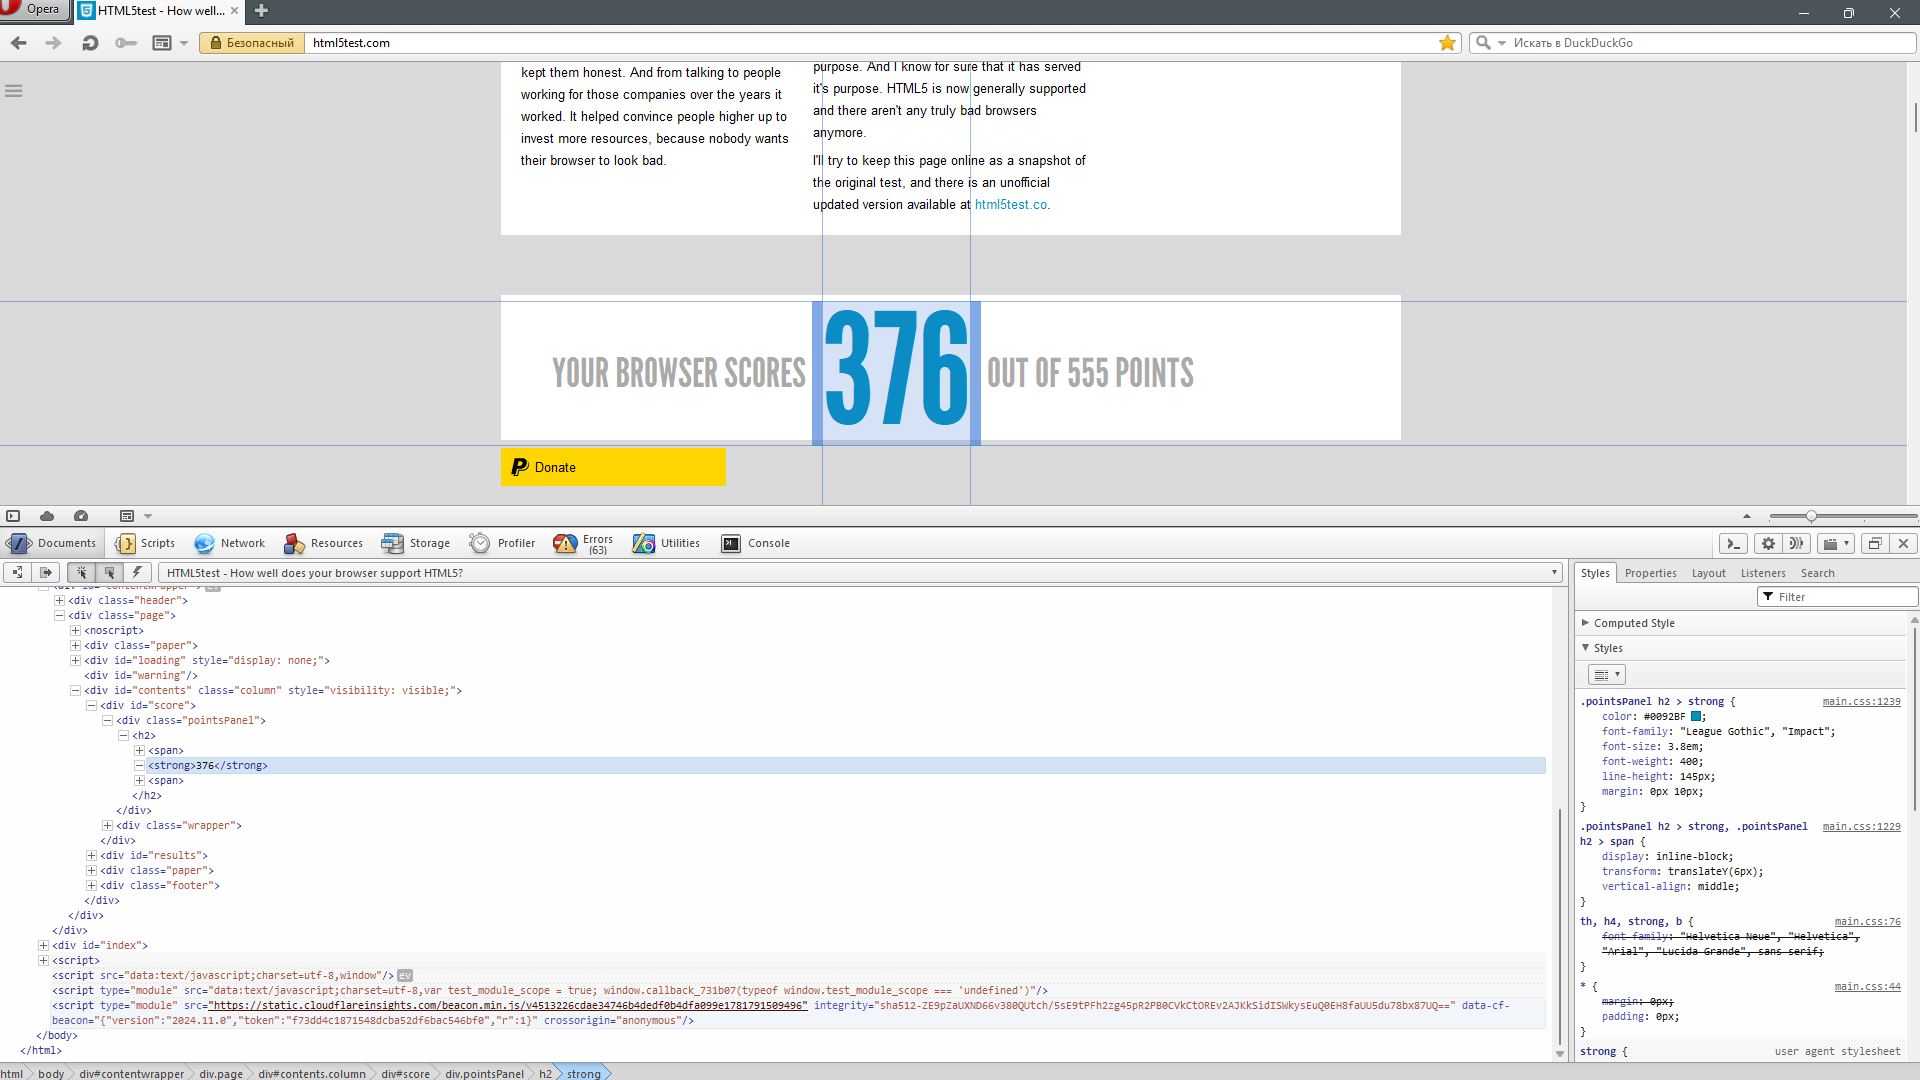
The way it is built is the quintessence of Opera’s approach. Everything homegrown, everything independent, and—damn it—designed so well that it still impresses to this day. Take the way the debugger interacted with the browser: we already know it used its own scope protocol, based on protobuf. Yet Dragonfly was so advanced that it could run even in Chrome and Firefox, which knew nothing about scope. In those cases Dragonfly implemented the required API itself through a proxy, and in more than one way. It could be either a WebSocket at /stp-1-channel or long polling with GET /get-message plus POST /post-command/<service>/<command>/<tag>.
It follows that a client like this cannot and should not use the browser’s UI. That is why Dragonfly contains its own UI framework (built around a concept very close to what would later show up in the Custom Elements specification), its own layout manager, its own markup templating engine, and its own localization logic.
All of that lives in five megabytes of JS/CSS/XML sources. There are two builders, both on Python 2: the old dfbuild.py and the new df2.py, and both do roughly the same thing—stripping comments, concatenating code, substituting values, minifying, and so on. That said, the client doesn’t need a build in order to run—the sources will work perfectly well as they are.
That’s it. It just works. I only rewrote the builder for Python 3, for the sake of tidiness.
XXVIII. What Can’t Dragonfly Do?
It would be strange to expect a decade-old debugger to have any modern capabilities, though even here it isn’t that clear-cut. There is more built into Dragonfly than it shows—for example, it has a subsystem for invoking the browser’s selftests (it isn’t used in any way, it simply exists), or ready-made JS debugger methods that never made it into the UI. But those are minor things.
The list of what’s missing is fairly long. Dragonfly:
- doesn’t support source maps;
- doesn’t parse WebSocket frames (although the transport protocol itself is supported);
- has no tools for artificial throttling;
- doesn’t emulate geometry and viewports;
- has no memory profiler (the debugger can walk objects, but doesn’t collect memory information);
- doesn’t support asynchronous call stacks (logically enough, the entire existing stack is synchronous);
- doesn’t inspect animations and transitions;
- doesn’t support what Presto itself can’t do: flexbox, grid, Service Workers, IndexedDB, Cache Storage, Shadow DOM, custom elements.
As a tool from 2012, Dragonfly is comparable to its contemporaries and in places better than them. Profiler granularity down to an individual CSS selector, an HTTP request builder, a list of event handlers with their sources, breakpoints on DOM events, and configurable keyboard shortcuts—all of that was ahead of the market back then, and some of it still isn’t available everywhere.
In the reality of 2026 it is good enough for debugging the pages Presto is capable of displaying. It won’t be enough for debugging a modern front end, but a modern front end won’t load in Presto yet anyway. And the intent here is different: the errors collected in Dragonfly will help find the gaps in the engine.
XXIX. A History of Shadow DOM, and Why It Exists
If you have ever built web pages, you have at least a rough idea of their structure. Here are the tags describing elements, here are their attributes, here are the selectors you can use to pick out the elements you need and hang something on them—a style rule or a script handler. Everything is in plain sight, both for the developer and for any client-side code.
But then a <video> tag turns up on the page—and that is no longer a single element, it is an entire player with buttons, indicators, a playback bar, and a volume control. So where do those buttons and sliders live?
That’s right—they live in the Shadow DOM, a separate, “shadow” area which by default is out of reach for the developer and for code alike.
Shadow DOM makes it possible to build complex, composite components whose structure isn’t visible from the outside. Thanks to “shadow” isolation, no changes to the light DOM (the ordinary, “light” tree) will touch the contents of such a component—the styles won’t shift, the scripts won’t glitch.
This is not the most exhaustive explanation, of course, but it conveys the gist.
The idea itself didn’t grow out of nowhere. Browsers needed hidden markup for their own elements: the media player, sliders, the search field. In WebKit, internal shadow trees were used for browser controls before the API itself existed; back in 2011 developers were already discussing support for such trees in the inspector and moving media elements onto them. Google proposed making that same mechanism the foundation of Web Components—a set of tools for reusable web components. The first public Working Draft came out on May 22, 2012.
But that Shadow DOM was not the one we have now. The early version, later named v0, allowed several shadow roots on a single host, distributed content through the <content> and <shadow> elements, and had its own boundary-piercing CSS combinators. The experimental WebKit implementation was inherited by Blink and became available to page authors there, but other vendors were unwilling to lock that model in. After long arguments, in 2015 WebKit proposed a simpler, slot-based scheme, close to the modern one. The old ::shadow and /deep/ were first deprecated and then removed from Chrome.
The stable cross-browser story only began after that. Shadow DOM v1 arrived in Chrome 53 in August 2016; the new WebKit was already on show in the first Safari Technology Preview that spring; Firefox enabled Shadow DOM and Custom Elements by default only in version 63, on October 23, 2018. By that point the standalone Shadow DOM specification had been retired: its concepts and algorithms went straight into the living DOM, HTML, and CSS standards.
At the time Opera Presto was shut down, the technology existed only as a pair of early drafts. Had the developers managed to implement them, the entire effort would have had to be thrown away. Now, though, we can look at where WebKit/Blink/Gecko ended up evolving: explicit tree scopes and specialized traversals within them.
XXX. The Illusion of Simplicity
All right, this doesn’t look hard. There is a description of the technology. There are three different examples of how it has already been done (they can’t be copied, but the implementation principles can be studied). There is a ready-made WPT suite for Shadow DOM.
The problem is that this is an entirely new entity for Presto—and a huge one. All the previous changes were either relatively small or simply extended capabilities already built into the engine.
Naturally, I first went looking for any kind of foothold, and I even found something. For instance, ShadowRoot does exist in Opera’s sources, but it is not at all the one we need. It is about SVG <use>; SVG also creates a tree that is invisible from the outside, but it does so by cloning. For Shadow DOM that approach is fundamentally wrong. A node assigned to a <slot> is obliged to retain its identity; host.firstChild, event.target inside its own scope, and the object a script is already holding must all keep pointing at one and the same node.
The old architecture did have other useful groundwork, though. DOM_DocumentFragment already owned a separate physical HE_DOC_ROOT. Printing, XSLT, and that same SVG had accustomed part of the engine to the existence of multiple trees. HTML_Element was able to take rare extensions in the form of ComplexAttr without inflating every element on the page. ElementRef notified its owner when a node was destroyed. CSS and layout had central places through which new semantics could be routed without rewriting literally everything.
In total there are over a thousand calls in the FirstChildActual, NextActual family and other physical traversals. Globally replacing them with “the new, correct traversal” would have been not only unmanageable but wrong: the parser, serialization, ordinary DOM APIs, and memory reclamation need precisely the old physical order. Shadow DOM doesn’t abolish the original tree, it adds several new answers to the question “whose child is this?”.
The main architectural decision can be put like this: there is no single “Shadow DOM tree” in the implementation. There are four related views, and none of them can be swapped for another with impunity.
Physical light tree        What ordinary DOM traversals see
Separate shadow tree       The internals of a specific ShadowRoot
Shadow-including tree      Connectivity, lifetime, GC, and the overall scope hierarchy
Flattened tree             Slots, styles, layout, focus, and the visible presentation
The first two are real, physical trees of nodes; the rest are computed from them and from the host–root and slot–assigned node relationships. Modern browsers are arranged in a similar way, but fitting such a model into Presto had to be done with Presto’s own means.
I’ll spare you a dive into the technical weeds and will only say that it was hard, long, and large-scale. The whole implementation fits into roughly 18k lines, including tests and changes to the CSS parser. Not everything went smoothly, and the implementation probably still contains errors that the tests haven’t caught. The changes are extremely invasive, touching almost every subsystem in Presto—the first test runs demonstrated that vividly, with crashes in the most unexpected places. It is also unclear how all this affected the browser’s speed—performance measurements and optimizations are not a priority just yet.
That is why I fell back on a capability I described at the very beginning. Shadow DOM got its own compile-time switch, FEATURE_SHADOW_DOM: the engine can be built without the shadow tree, fully preserving the old behavior. This is the first feature of its kind added since the work began.
XXXI. What’s Next?
Now that we have a full-featured debugger, we can turn the browser loose on a site, see what specifically doesn’t work, and get to work. Too early for that work yet—but the foundation is there now.
The main place the effort will go is, of course, ECMAScript. Plenty has already been said about how pointless a browser is without modern JS. Then CSS. And along the way, the many APIs that everything else rests on.
For a while yet the browser will still look like it is stuck in 2013. But once all the core features are implemented, support for the modern web will be restored very quickly.